

How to Reduce Shopping Cart Abandonment: 6 Fixes From 1,200+ A/B Tests

[ SUMMARIZE WITH AI ]
[ FREE CRO TEARDOWN ]
Find the 3 biggest revenue leaks on your store.
Every day a conversion leak goes unfixed, you're paying for traffic that doesn't buy. Get a 5-minute Loom through your PDP, cart, and checkout, with mockups of the fixes. No pitch.
Get My TeardownHow to reduce shopping cart abandonment is a question almost every Shopify brand answers with the same recycled list: simplify checkout, add trust badges, offer free shipping. If those fixes worked, your abandonment rate would already be lower. The honest playbook to reduce shopping cart abandonment starts with a different premise: a 70% drop-off is not a checkout design problem, it is a testing problem.
Brands that actually recover revenue run controlled A/B experiments on the highest-traffic moments in the funnel and measure what moves the needle, instead of rolling out site-wide changes that help some visitors and do nothing for others. Below are six cart and checkout tests from our client portfolio that together produced $550K+/month in measured lift, with the exact friction each one solved.
Last updated May 2026. Reviewed against 1,200+ A/B tests run on $2M+ DTC Shopify brands by Julian Samarjiev, Co-founder of Convertibles. Benchmarks cross-referenced with Baymard Institute checkout research and Shopify-published cart data.
Reducing Cart Abandonment at a Glance
- The scale of the problem: Global average cart abandonment is 69.99% (Baymard Institute). Top causes: unexpected costs (48%), forced account creation (24%), complicated checkout (21%)
- What our tests show: Six cart and checkout A/B tests from our Shopify Plus client portfolio produced a combined $550K+/month in measured lift. The single biggest winner: +$389,565/month from a checkout button change.
- Why generic fixes fail: They apply one change to all traffic. Real lift comes from identifying the specific friction point for a specific visitor segment, then testing the fix with statistical rigor before rolling it out.
- Highest-value test surfaces: Cart drawer, checkout button, upsell placement, and trust signal structure consistently outperform cosmetic changes like color swaps or copy tweaks.
- Testing cadence: 2-4 experiments per month, minimum 14 days per test, 95% statistical significance required before calling a winner.
Why Standard Cart Abandonment Advice Fails
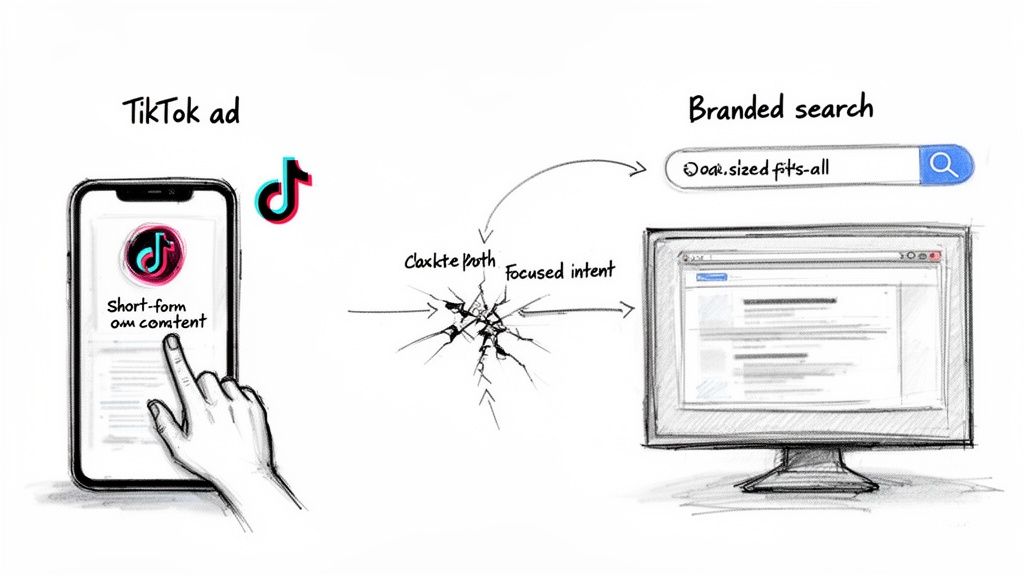
Most conversion optimization advice treats every visitor as if they landed on your site with the exact same mindset and goal. This one-size-fits-all approach is precisely why so many brands hit a revenue ceiling. It completely ignores the reality of modern ecommerce: traffic is not a monolith.
Consider two distinct shoppers:
- Visitor A finds you through a branded search on their desktop. They already know you, they're looking for something specific, and they came ready to buy.
- Visitor B taps through from a TikTok ad on their phone. They've likely never heard of your brand, were drawn in by an impulse-driven video, and have low initial purchase intent.
Routing both visitors through the exact same checkout experience is a predictable source of lost sales. Visitor A wants a fast, frictionless path to buy. Visitor B needs more convincing: social proof, an offer that matches the ad creative, and a mobile payment option that doesn't require typing 16 digits. When the experience doesn't match what brought them there, they leave.
The True Cost of a Generic Experience
The global average cart abandonment rate is 69.99%, according to the latest shopping cart abandonment rates research from the Baymard Institute. The top reasons are consistent year over year: unexpected extra costs (48%), forced account creation (24%), and a long or complicated checkout (21%).
The typical fixes for these - add a free shipping bar, enable guest checkout, reduce form fields - are not wrong. They just don't get to the why for specific visitor segments. A first-time mobile visitor from paid social is far more sensitive to surprise shipping costs than a returning desktop customer with a high AOV. A blanket fix moves the average while leaving the highest-value leaks open.
The table below shows how a segment-aware approach tackles these issues more precisely than generic changes.
Top Cart Abandonment Reasons and Segment-Specific Fixes
| Abandonment Reason (Baymard Data) | Generic Fix | Segment-Specific Fix |
|---|---|---|
| Extra costs too high (48%) | Show a free shipping bar. | For low-intent paid social traffic, display the offer prominently upfront. For returning customers, remind them of their existing free shipping threshold - they don't need the full pitch. |
| Account creation required (24%) | Add guest checkout. | Enable guest checkout for all new visitors. For returning customers with saved information, surface a "Welcome back" prompt with one-click login instead. |
| Complicated checkout (21%) | Reduce form fields. | For mobile visitors, lead with Apple Pay or Shop Pay. For desktop users, pre-fill known fields and offer a streamlined traditional form. |
| Can't see total cost upfront (18%) | Add a shipping calculator. | For visitors in high-shipping-cost regions, surface a localized message on the product page itself - before they reach the cart. |
| Website errors/slow load (17%) | Improve site speed. | Monitor performance by device and segment. If your highest-converting mobile device has a slow checkout, fix that path before anything else. |
| Don't trust site with card info (17%) | Add trust badges. | For first-time visitors, lead with social proof and security seals. For logged-in returning customers, remove the clutter - they already trust you. |
The segment-aware approach isn't about doing more work; it's about directing the same effort at the visitors who will actually respond to a given fix.
What Our Tests Show: 6 Cart and Checkout Wins
These results come from Convertibles' test archive: more than 1,000 A/B experiments run on Shopify Plus stores doing $2M to $160M+ in annual revenue. Every test ran on live traffic with statistical significance confirmed in Intelligems. Every store is anonymized.
Six of those tests ran directly on cart and checkout surfaces. Combined monthly revenue lift across the six: $551K+. The pattern that runs through all of them: clarity beats cleverness. Structural changes to what information is visible - and when - consistently outperformed persuasion add-ons.
| Test | Monthly Lift | What Drove It |
|---|---|---|
| Checkout Button Price Display | +$389,565 | Showing the order total directly on the checkout button. The single biggest cart/checkout winner in the portfolio - a structural clarity change, not a persuasion tactic. |
| Free Gift Tier Progress Bar | +$50,099 | A visible progress bar toward a gift threshold outperformed a static "spend $X for free gift" banner. Making the gap visible motivated adds to cart. |
| Focused Upsell with Trust Signal | +$40,313 | One relevant upsell paired with one trust signal beat both elements shown in isolation. Context reduced the friction of the decision. |
| Cart Upsells vs Trust Badges | +$33,072 | Upsell-first cart structure beat trust-badge-first. For this store's returning customer base, AOV was the barrier - not trust. |
| Trust Signals and Savings Visibility | +$32,605 | Showing security signals alongside the discount amount outperformed showing either element alone. |
| Checkout Page Reviews and Social Proof | +$6,145 | Review excerpts on the checkout page drove incremental lift. Smaller than the structural tests above, but statistically clean. |
For the complete test write-ups, see the Shopify A/B test case studies archive. For the methodology behind how we run these programs end-to-end, see our Shopify A/B testing service page.
Finding the Real Leaks in Your Funnel

Your site-wide cart abandonment rate is a vanity metric. It tells you there's a problem, but it hides where you're bleeding money. To make a real dent, you have to stop looking at averages and start diagnosing the specific user journeys that are broken.
The goal isn't to nudge a percentage down. It's to identify the high-value orders slipping through and find the specific friction point causing them to drop.
Where to Start: Segment Your Abandonment Data
Instead of fixating on the blended number, slice your abandonment data by key dimensions. Your analytics platform - whether it's Google Analytics 4 or Shopify's native analytics - is the right tool for building custom funnels to see what's happening beneath the surface.
Start with these four segments:
- Traffic Source: Are visitors from Meta ads abandoning at a higher rate than those from organic search? That's a sign of a mismatch between ad creative and the on-site experience.
- Device Type: Is mobile abandonment significantly higher than desktop? This almost always points to checkout friction on smaller screens.
- Customer Lifecycle Stage: Are new visitors abandoning more than returning customers? Or are loyal customers suddenly dropping off? Each scenario needs a different fix.
- Product Category or AOV: Are shoppers abandoning carts with your highest-value items? This could indicate sticker shock, trust gaps, or a lack of financing options at high price points.
By isolating these groups, you move from guessing to hypothesis-driven testing. You might find that your highest-AOV customers are abandoning on mobile - a specific, high-impact problem you can actually solve.
The Most Common Leak: Mobile Friction
Mobile shopping abandonment rates run as high as 85.65%, versus 73.07% on desktop. If you're running paid social ads where nearly all traffic is mobile, that gap is a direct hit to your ad ROI.
The friction usually comes from a few repeating sources: checkout flows that are too long, shipping costs that aren't surfaced until the final step, and payment options that require manual card entry on a small screen.
The useful distinction isn't just "mobile is worse" - it's which mobile visitors are dropping and at which step. A high abandonment rate among first-time mobile visitors from paid ads is a different problem than a high rate among returning mobile customers at the payment step.
How to Build Your Diagnostic Funnel in GA4
Build a custom checkout funnel exploration report in GA4. This is the baseline diagnostic for any serious ecommerce optimization program.
A simple starting funnel:
- Session Starts
-
View Product (
view_itemevent) -
Add to Cart (
add_to_cartevent) -
Begin Checkout (
begin_checkoutevent) -
Purchase (
purchaseevent)
Once the funnel is running, apply segments as comparisons. Create one segment for "Mobile Traffic" and one for "Desktop Traffic," then compare their funnel reports side by side. You'll see the exact step where mobile users drop off relative to desktop - and that step becomes your first test hypothesis.
From there, the test brief writes itself: "Fix the payment step experience for new mobile visitors from Instagram ads." That's a problem you can scope, test, and measure.
High-Impact Cart Fixes for Paid and Returning Traffic
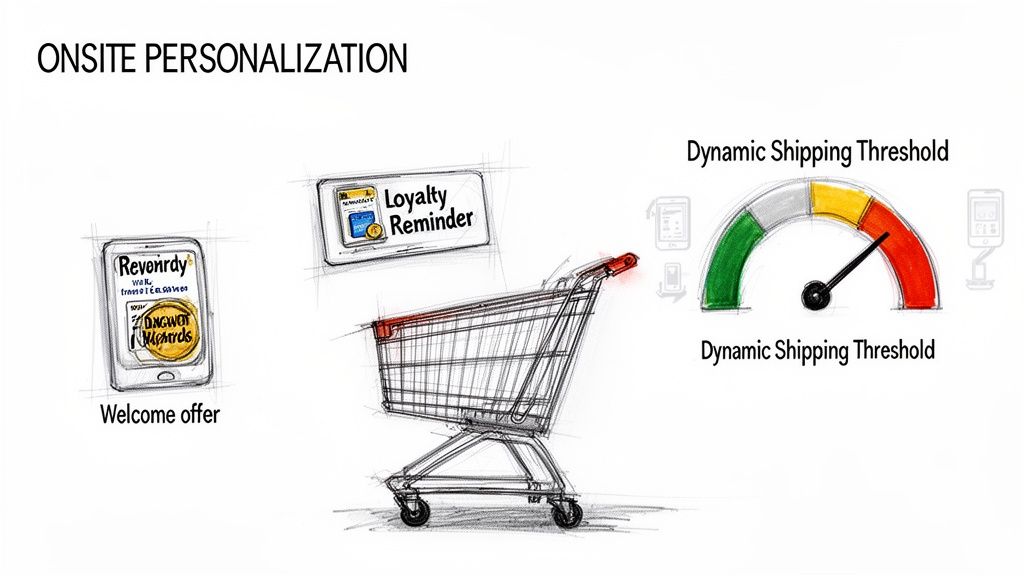
You've found your biggest leaks. Now you need to prioritize which to fix first. The right framework is simple: potential revenue lift vs. ease of implementation. Start with the high-traffic segments where a targeted fix can produce a fast, measurable result.
Match Your Welcome Offer to Your Ad Creative
One of the fastest ways to lose a paid social sale is a disconnect between the ad and the landing experience. Someone clicks a TikTok ad for "20% Off Your First Order" and arrives on your site with no mention of the deal. They have to hunt for a code, or the offer isn't there at all. The momentum breaks and trust drops.
For new visitors from paid social - especially on mobile - a few approaches that consistently test well:
- A persistent top banner: "Welcome, TikTok shoppers - your 20% off is automatically applied at checkout." Constant, low-friction confirmation.
- A cart-level confirmation: Once they add an item, the cart shows the discount line explicitly. "First-timer discount: -$15.00."
- An ad-synced welcome prompt: A modal that matches the ad creative and offer, triggered on landing for UTM-tagged traffic.
Consistent messaging from ad to site is one of the highest-leverage fixes for cold paid traffic. It answers the subconscious question "am I in the right place?" before the visitor has to ask it.
Reduce Friction for Returning Customers
Returning customers already trust you. Showing them the same new-visitor discount offer isn't just wasteful - it can train them to wait for a deal rather than buying at full price.
The goal for returning visitors shifts from building trust to lowering the activation energy to buy again:
- Show loyalty points in the cart: "You have 500 points - redeem now for $5 off." Don't bury this in an account page.
- Use dynamic shipping thresholds: "You're $12 away from free shipping" is more motivating than the generic threshold message.
- Surface complementary products: In the cart, recommend items that pair with what they've previously bought - not generic bestsellers.
Small touches like these compound. They reinforce the value of returning and reduce the need to discount to close the sale. For more on what the highest-lift cart tests look like in practice, see the Shopify CRO agency overview.
Fine-Tuning Your Cart and Checkout
The cart and checkout pages are where even small friction costs real money. Most brands know they should "simplify the process" - the question is where exactly to test and in what order.
The test data above gives a starting point: checkout button structure and gift tier progress bars produce the largest lifts. Here's how to approach the next tier of optimizations.
Turn Your Shipping Threshold into an Active Upsell
A static "Free Shipping Over $75" banner is a passive message that makes the customer do the math. A dynamic threshold message does the work for them.
- When the cart is below the threshold: "You're only $17.30 away from FREE shipping." The gap becomes a small, closeable problem instead of a penalty.
- When the cart clears the threshold: Acknowledge it. "You've earned FREE shipping." The positive confirmation reinforces the decision to add more.
This shift changes the dynamic from "fee I might have to pay" to "reward I'm close to earning" - a framing that consistently tests better.
Lead with Express Payment on Mobile
According to the Baymard Institute, 21% of shoppers abandon because the checkout is too long or complicated. On mobile, that friction is amplified - manually entering card details on a small screen is a high-drop-off moment.
The fix is straightforward: match the payment option order to the device and browser.
- Safari on iPhone: Apple Pay front and center.
- Chrome on Android: Google Pay or Shop Pay first.
- All others: PayPal or Amazon Pay before the traditional card form.
It's not about having these options available - most stores do. It's about the order of presentation. Every tap saved is one less chance for the visitor to abandon.
Get Specific with Exit-Intent Offers
A generic "10% off" popup fired at every exiting visitor is one of the fastest ways to train customers to wait for a discount. The segmented version performs better and protects margin.
- New visitor, high-value cart: "Free Shipping and Returns on Your First Order" addresses the two most common trust gaps without a discount.
- Returning customer, low-value cart: "Complete your order and earn 100 loyalty points" makes the purchase worth more without cutting price.
- Paid social traffic: "Don't miss the [product] everyone's been ordering" - a relevance reminder, not a discount.
Tailor Trust Signals by Visitor Type
Trust signals work - but their impact varies significantly depending on who's reading them. A first-time visitor from a Meta ad has different anxieties than a logged-in returning customer.
- New visitors: Lead with social proof - "Join 100,000+ customers" - and show security seals prominently. A single review excerpt near the payment step can also move the needle (see the $6,145/month test above).
- Returning customers: Clean up the clutter. Surface account-specific benefits instead - "Easy returns for members" or "Your saved info is ready." They don't need to be convinced you're legitimate.
Building a Testing Program That Compounds
One-off fixes deliver a one-time bump. A structured testing program delivers compounding returns - each winning test becomes the new baseline, and the learnings from losing tests inform the next round of hypotheses.
The goal is a continuous improvement loop: identify a high-value problem for a specific visitor segment, build a test, run it to significance, and operationalize the winner. Every cycle leaves the site in a better state than the previous one.
From Ideas to Revenue Lift
A scalable program isn't about having more ideas - it's about having a disciplined process to bring the right ideas to life. This means moving beyond simple A/B tests toward multi-variation experiments where appropriate: testing three or four variants simultaneously on high-traffic pages captures more signal in less time.
Rigorous measurement is what separates real wins from noise. Did that welcome offer for TikTok traffic actually boost conversion by 15%, or did it hand a discount to visitors who would have bought anyway? Controlled testing with revenue-per-visitor as the primary KPI is the only way to know. Our guide on how to improve ecommerce conversion rate covers the measurement framework in more detail.
Building a Testing Roadmap
A documented testing roadmap is what keeps the program moving and prevents teams from re-testing the same ideas or losing context between cycles. It should cover at least the next 2-3 months and define four things for each test:
- What: The specific change being tested (e.g., dynamic shipping threshold message in the cart).
- Who: The exact segment being targeted (e.g., returning mobile customers with a cart value between $50-$75).
- Why: The hypothesis (e.g., "A personalized shipping nudge will increase AOV by 5% for this group").
- How you'll measure: The primary KPI (Revenue Per Visitor, not just conversion rate).
A healthy program runs 2-4 tests per month. Fewer than that and momentum stalls; more than that without enough traffic and you're splitting signal too thin.
Sample 3-Month Testing Roadmap
| Month | Focus Segment | Test | Primary KPI |
|---|---|---|---|
| Month 1 | New visitors (paid social) | 10% discount welcome offer vs. free shipping offer vs. control | New customer conversion rate |
| Month 2 | Returning customers (mobile) | Dynamic "you're $X away from free shipping" message in cart for $50-$70 cart values | Average Order Value |
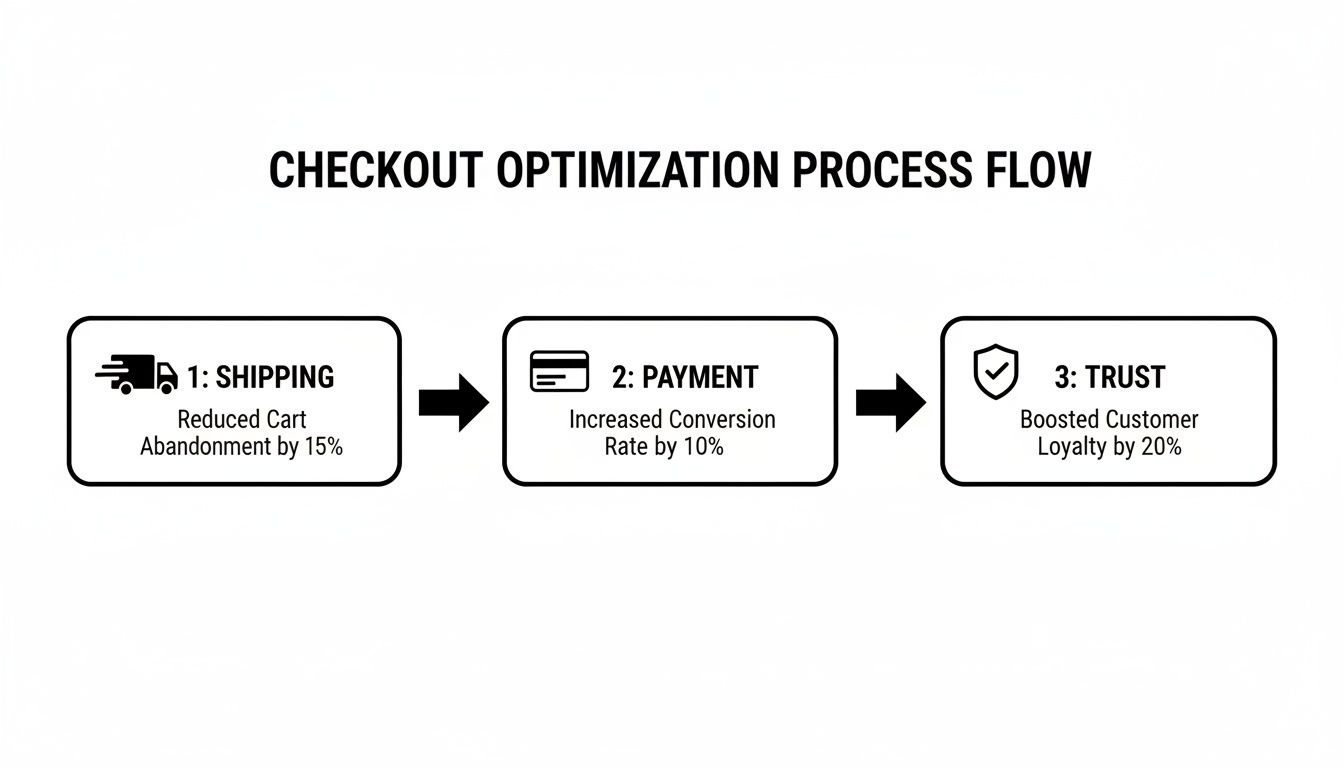
| Month 3 | High-intent exiters (checkout) | Checkout button with price display vs. standard "Complete order" button | Checkout completion rate |
Measuring What Matters
Track more than conversion rate. Revenue Per Visitor captures both the conversion rate movement and the AOV movement together - it's the right north star for cart optimization work. Pair it with Customer Lifetime Value to make sure you're not optimizing for first purchases at the expense of repeat revenue.
When a test wins, operationalize it: the winning version becomes the new default for that segment, and the insight behind the win gets documented. Did a trust-building message outperform a discount for new visitors? That finding should immediately shape the next three hypotheses.
This cycle - hypothesize, test, measure, operationalize - is what produces the compounding returns. The site gets smarter with every test cycle, and the program builds an institutional knowledge base that makes each subsequent cycle more efficient.
Answering Your Top Cart Abandonment Questions
How Quickly Can I Actually See Results?
You can see a lift almost immediately after a winning test goes live. A single, well-targeted experiment can produce a statistically significant revenue bump in as little as 2-4 weeks.
The key is to start with your highest-traffic, highest-value segments rather than trying to optimize everything at once. A focused test on new mobile visitors from your top-performing paid ad campaign gives you a fast, clean result to build on.
What's the Minimum Tech Stack I Need for This?
You need three tools:
- Analytics: Google Analytics 4 or Shopify's native analytics to diagnose where the funnel is leaking.
- A/B testing platform: A tool that lets you test different experiences without requiring a developer for every change. We use and recommend Intelligems.
- A testing roadmap: A single place to track what's running, what's queued, and what the results were. We built TestBuddy for this.
Should I Start with the Product Page or the Cart Page?
Start closer to the money: the cart and checkout. Friction at this final stage has an immediate, direct impact on revenue. Fix the leaks there first, then work back up the funnel to product pages once you've confirmed the checkout is clean. This cart-to-confirmation work is exactly what our Shopify checkout optimization service runs end to end.
The $389,565/month checkout button test is a useful reference point: a single change at the final step outperformed every product page test in the same period. The closer to the transaction, the higher the leverage.
How Do I Know My Test Results Are Real and Not Just Luck?
Statistical significance at 95% confidence means you can be 95% certain the lift is a direct result of the change, not random variation. Your testing platform handles the calculation - your job is to not call the test early.
Run tests for at least 14 days on any volume of traffic, and longer for lower-traffic stores. Cutting a test short because it looks like a winner on day three is one of the most common ways to ship a change that doesn't actually hold.
The fixes outlined here are drawn from more than 1,000 A/B tests run on Shopify Plus stores. The consistent finding across cart and checkout work: structural clarity - what information is visible, in what order, at what moment - produces larger lifts than persuasion tactics layered on top of a confusing experience.
Your next step is to run the GA4 funnel diagnostic, identify your highest-value abandonment segment, and scope a test for that specific problem. If you want a second set of eyes on where the biggest leaks are, book a discovery call - we'll walk through your funnel and show you where we'd test first.