Split Testing Landing Pages: A Shopify Plus Playbook (2026)

[ SUMMARIZE WITH AI ]
[ FREE CRO TEARDOWN ]
Find the 3 biggest revenue leaks on your store.
Every day a conversion leak goes unfixed, you're paying for traffic that doesn't buy. Get a 5-minute Loom through your PDP, cart, and checkout, with mockups of the fixes. No pitch.
Get My TeardownSplit testing landing pages means running controlled experiments where you show different page versions to different visitors, then measure which version drives more conversions and revenue. For Shopify Plus brands spending $50K+ monthly on paid traffic, this process is the difference between burning ad spend and building a profit machine.
Strategic split testing landing pages turns ad spend into predictable profit. This is not a one-off marketing tactic. It is a core business process for maximizing your return on ad spend (ROAS).
Stop Wasting Ad Spend on Generic Landing Pages
If you are spending over $50,000 a month on channels like Meta or Google, every visitor has a real cost attached. Sending this expensive, hard-won traffic to a landing page that does not convert is like filling a bucket with a hole in the bottom.
The problem is that a one-size-fits-all page speaks to an "average" customer who does not exist. It misses the specific needs, motivations, and mindset of your different customer segments.
The performance gap between average and top-performing landing pages is significant. Top performers consistently see conversion rates 2-3x higher than their baseline. For a brand spending six figures on ads, that gap is not a small inefficiency. It is a profit killer.
The Real Cost of an Untested Page
Let's translate this into real dollars.
This table shows how a lift in conversion rate impacts monthly revenue. For a brand with significant traffic, the difference between an average page and a tested, optimized page is massive.
| Monthly Traffic | Average Order Value (AOV) | Baseline Conversion Rate (2.5%) | Improved Conversion Rate (4.5%) | Monthly Revenue Uplift |
|---|---|---|---|---|
| 50,000 | $120 | $150,000 | $270,000 | +$120,000 |
| 100,000 | $120 | $300,000 | $540,000 | +$240,000 |
| 250,000 | $120 | $750,000 | $1,350,000 | +$600,000 |
This uplift is not a small tweak. It is a fundamental shift in business trajectory.
This is the difference between a campaign that breaks even and one that funds your next phase of growth. Split testing turns your landing page from a simple expense into a powerful profit multiplier.
Moving From Tactic to Strategy
Thinking of split testing as just changing a button color or a headline misses the point. For ambitious Shopify Plus brands, it is a systematic way to understand what makes your customers tick and turn those insights directly into revenue.
You are creating a continuous feedback loop where every test, win or lose, makes your entire marketing program smarter and more efficient. This is the foundation of a proper CRO testing program that compounds gains over time.
The goal is to build high-converting landing pages that grab attention and drive sales, making sure every ad dollar works as hard as it can. This requires moving past random guesses and fully embracing a data-driven approach.
When you start treating your landing pages as dynamic assets that need constant improvement, you build a powerful, lasting competitive advantage.
Building a Test Hypothesis That Actually Wins
Great tests start with great questions, not random guesses. If you are A/B testing button colors, you are playing in the shallow end. Powerful split testing begins with a strong, data-backed hypothesis that targets a specific user behavior you want to change.
To get there, you have to stop guessing what might work and start digging into your data to understand what is happening and, more importantly, why. This means blending two different but equally important types of insight.
Blending Quantitative and Qualitative Data
First, follow the numbers. Quantitative data is the "what" of user behavior, and it is hiding in plain sight within your analytics.
- Google Analytics 4 (GA4): Start in your landing page reports. Where are people leaving? Look for pages with high bounce rates or engagement times well below your site average. That is where the money is leaking out.
- Heatmaps and Session Recordings: Tools like Hotjar or Microsoft Clarity are non-negotiable. Watch how real people interact with your page. Are they rage-clicking on an image they think is a button? Are they scrolling right past your main call-to-action? This visual evidence shows you friction points that GA4 alone will never reveal.
This quantitative work tells you where the problems are. It will not tell you why. For that, you need to talk to your customers.
Qualitative insights are the "why" behind the charts. They come from real human feedback and are critical for understanding what motivates, or frustrates, your users.
- Customer Surveys: Use simple post-purchase surveys or on-site polls to ask. "What almost stopped you from buying today?" is a killer question.
- Support Tickets and Live Chat Logs: Your customer service team is sitting on a goldmine. What are the most common questions they get about a product? What complaints keep popping up?
- User Reviews: Read the language your customers use. What benefits do they rave about? What frustrations do they vent about?
When you combine a high drop-off rate on a product page (the "what") with a dozen support tickets asking about shipping times (the "why"), you have the foundation for a test that can actually make a difference. At Convertibles, this blend of quant and qual data is where we start every testing engagement.
Structuring a Powerful Test Hypothesis
Once you have gathered your intel, frame it as a formal hypothesis. A strong hypothesis is not a vague idea. It is a predictive statement you can prove or disprove with your test.
A winning hypothesis has three core components: a proposed change, a predicted outcome, and the reasoning behind it. This framework turns a hunch into a testable, strategic action.
Here is a simple structure we use:
"By changing [The Variable] for [A Specific Segment], we predict [The Desired Outcome] because [The Data-Backed Rationale]."
Let's plug this into a real-world ecommerce scenario.
Example Scenario:
A high-end skincare brand runs an Instagram ad campaign featuring a "Get the Look" video. The ad drives traffic to a landing page featuring only the one hero product from that video.
- Quantitative Data: GA4 shows traffic from this campaign has a 75% bounce rate and a tiny 1.2% conversion rate. Heatmaps from Hotjar show users scrolling frantically, as if they are looking for something that is not there.
- Qualitative Data: The comments on the Instagram ad are full of people asking, "What other products were used in the video?"
With this ammo, the team can build a hypothesis that goes way beyond "let's test the CTA button text."
Hypothesis: "By replacing the single hero product with a 'Shop the Complete Look' bundle on the landing page for our Instagram ad traffic, we predict an increase in Average Order Value (AOV) by 15% and a 2% lift in conversion rate, because user comments and on-page behavior indicate they want to purchase the entire routine shown in the ad, not just one product."
This hypothesis is specific, measurable, and directly connected to observed behavior. It moves past generic tweaks and creates a strategic test aimed squarely at a business goal: making more money.
Designing Tests for Your High-Value Customer Segments
Optimizing your landing page for the "average" visitor is a trap. The average visitor does not exist. Your traffic is a mix of real people with different needs and motivations, and a one-size-fits-all approach speaks to nobody.
To see real gains from split testing, you have to get specific. The magic happens when you design tests for distinct, high-value customer groups. You stop asking, "Which headline works best for everyone?" and start asking, "Which headline converts best for first-time visitors from our TikTok ads?" That shift in thinking separates a minor lift from a major jump in profit per visitor.
First, Identify Your High-Value Segments
Before you can personalize, you need to know who you are talking to. Pinpoint the segments with the biggest growth potential or those being let down by your generic page.
Jump into your analytics and look for the clear dividing lines in your audience.
- New vs. Returning Visitors: This is a basic, yet powerful, segment. A first-timer needs to be convinced you are trustworthy. They are looking for social proof and a clear reason to buy. A returning customer already knows you. They might be more interested in loyalty perks, new arrivals, or a restock reminder.
- Traffic Source: Think about intent. Someone who searched Google for "vegan leather tote bag" is in a different headspace than someone who clicked a link in a fashion blogger's Instagram Story. The searcher is ready for product details. The Instagram browser is more likely to be swayed by lifestyle photos and influencer quotes.
- Device Type (Mobile vs. Desktop): This is more about where than who. Mobile users are often distracted and need a dead-simple experience with big, clear CTAs and easy payment options. Someone on a desktop has more screen real estate and might be more willing to dig into detailed content.
- Geographic Location: If you sell across the country or around the world, location matters. You could test different shipping offers for customers in California versus New York. You might even show different product photos based on the local weather.
You would not use the same sales pitch on a new lead that you would use on a loyal, long-time customer. Your landing pages should not either. Segmenting is how you tailor that digital pitch.
Crafting Test Variations for Specific Segments
Once you have locked in on a high-value segment, build a test hypothesis just for them. This is where you move from theory to revenue. The goal is to match the landing page experience to the user's mindset and motivation.
Let's walk through a couple of real-world examples.
Example 1: Targeting New Visitors from a Facebook Ad
- Problem: These people saw a cool ad, but they do not know you. Their awareness is high, but their trust is rock-bottom.
- Control: Your standard, all-purpose landing page with a hero image and product benefits.
-
Variation: A new version of the page that goes all-in on building trust, fast. You could try:
- Sliding an "As Seen In" banner with logos like Forbes or Vogue right under the main image.
- Showcasing a large block of user-generated content (UGC) with glowing five-star reviews.
- Embedding a short video testimonial from a happy customer.
- Adding a "Welcome Offer: Get 10% off" pop-up in exchange for their email.
Example 2: Targeting Returning Customers
- Problem: They already trust you, but they need a nudge to buy again. Showing them the same new-customer-focused page is a missed opportunity.
- Control: Your generic landing page that everyone sees.
-
Variation: A personalized version that recognizes they have been here before.
- Change the headline from "Discover Our Best-Selling Skincare" to "Welcome Back! See What's New."
- Instead of a first-timer discount, offer them early access to a new collection or a "buy one, get one 25% off" deal on an item they have bought in the past.
- Dynamically add a "Restock Your Favorites" section based on their order history.
When you design tests for specific segments, you stop yelling into a void and start having meaningful conversations. This is how pros use split testing, not just to find one "winner," but to build a playbook of high-performing experiences for every type of customer.
The Technical Side of Launching a Test
You have a solid, data-backed hypothesis and know which customer segment you are targeting. Now for the technical part. A rigorous process is non-negotiable here. Rushing this stage sets you up for garbage results, wasted ad spend, and flawed conclusions that can haunt your strategy for months.
Getting the technical details right from the start is the only way to ensure the data you collect is clean, trustworthy, and statistically sound. It is what allows you to confidently declare a winner.
First, Do the Math: Sample Size and Test Duration
Before building a variation, define what a "win" looks like statistically. Running a test until it "feels" done is a rookie mistake. You must calculate the required sample size and estimate the test duration upfront. This guarantees your results have real statistical power.
Here is what you need:
- Baseline Conversion Rate: Your starting line. What is the current conversion rate for your control page for the segment you are targeting? Pull that number.
- Minimum Detectable Effect (MDE): The smallest improvement you would care about. A 10-15% relative lift is a decent place to start, but for a high-traffic page, you might be interested in a much smaller MDE.
- Statistical Significance: The industry gold standard is 95% confidence. Do not touch this. It means you are comfortable with a 5% chance that your results are just random noise.
Use our free online sample size calculator to plug in these numbers. The output tells you exactly how many visitors you need for each variation to get a reliable result. If it says you need 10,000 visitors per variation for your A/B test, you will need a total of 20,000 visitors before you can legitimately analyze the outcome.
This calculation is a reality check. If the calculator says it will take six months to reach significance, you either need to rethink your hypothesis to aim for a bigger MDE or pick a higher-traffic page to test. For most Shopify Plus brands with healthy ad budgets, a well-planned test usually hits significance in about two to four weeks.
One of the biggest mistakes you can make is stopping a test early because one variation is pulling ahead. This is called "peeking," and it is a surefire way to get a false positive. Commit to the sample size you calculated and let the test run its course.
This workflow shows our approach to segment-driven testing: identify the audience, tailor the test for them, and then target them effectively.
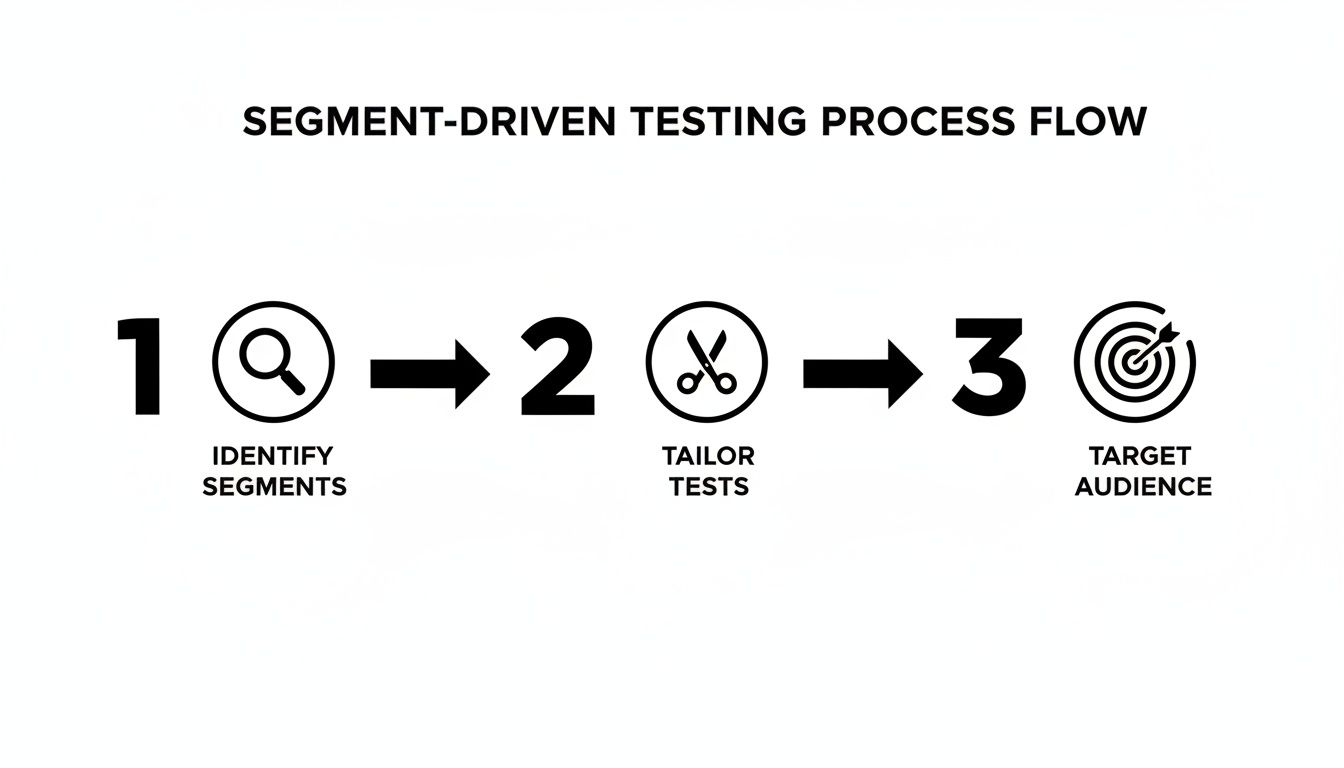
Following this process ensures every test you run is strategic. You move beyond generic, site-wide changes and start delivering experiences that connect with specific groups of customers.
Gearing Up: The Right Tools for Shopify Plus
Shopify's native features will not cut it for sophisticated landing page testing. High-growth brands lean on specialized platforms that integrate directly with Shopify to do the heavy lifting.
Tools like Intelligems are built for this. They handle traffic splitting, rendering different variations without flicker, and tracking results accurately. They are the engine behind any serious CRO and personalization program.
These platforms let you move past simple A/B tests and into more advanced setups. They manage the complex technical work so you can focus on strategy. At Convertibles, we use Intelligems to run high-velocity testing programs for our clients. If you want help getting this kind of system in place, our team specializes in Shopify 2.0 theme upgrades and A/B testing services.
The Pre-Flight QA Checklist
Never hit "launch" without a meticulous quality assurance check. A single broken link, a weird rendering bug, or a tracking error can torch your test and flush thousands of ad dollars down the drain. Go through this checklist on your control and on every single variation.
- Hunt for Flicker: Load the page. Do you see the original version for a split second before your test variation appears? That is the "flicker effect," and it can seriously bias your results. It is a common problem with client-side tools that are not set up perfectly.
- Test Every Device: Open the pages on Chrome, Safari, and Firefox. Then do it again on an iPhone, an Android phone, and your desktop. Make sure every button, image, and block of text looks and works exactly as intended. Pay extra attention to mobile. It is probably where most of your customers are.
- Check All Links: Click everything. Every single link. The main CTA, the nav menu, the footer links, the tiny "privacy policy" text. Make sure they all point to the right place.
- Confirm Your Tracking: Pop open your browser's developer tools and watch the network requests. Are your analytics events for pageviews, add-to-cart and purchases firing correctly on all variations? Double-check that your testing platform is passing its data to GA4 properly.
- Validate Your Targeting: If your test is aimed at a specific audience (like first-time visitors from the UK), use a VPN or an incognito window to pretend you are that user. Does the test show up? Now, try again as a user who should not see the test. Do you see the default page?
This is not busywork. This checklist is the professional discipline required to run clean experiments. It ensures the data you collect is trustworthy enough to make crucial business decisions.
Analyzing Results and Scaling Your Winners
A winning test is only as good as your ability to read the data. Once your experiment has hit its calculated sample size, it is time to dig in. Declaring a winner is not as simple as picking the variation with the highest conversion rate. If you misinterpret the numbers, you could roll out a "winner" that actually hurts your bottom line.
The first thing to check is statistical significance. Your testing platform will handle the calculation, but you need to know what it means. The industry standard is a 95% confidence level. In plain English, this means there is only a 5% chance the results are a fluke. If your test does not hit this benchmark, you do not have a winner. You just have noise.
Look Beyond a Single Conversion Metric
Many brands get laser-focused on one metric, usually the main conversion rate. While important, it does not paint the full picture of profitability. A new design might get more people to click "Add to Cart," but what if those same customers are spending less?
This is why you must look at the secondary metrics that tie directly to revenue.
- Average Order Value (AOV): Did your new page design encourage people to add more to their cart? A 5% lift in conversion rate sounds great, but not if it comes with a 15% drop in AOV.
- Revenue Per Visitor (RPV): This is the holy grail. RPV combines your conversion rate and your AOV (RPV = Conversion Rate x AOV) to give the clearest view of how much money each visitor is generating. A true winner moves this number up.
Let's look at a realistic example. Imagine you ran a test hoping to increase add-to-carts.
| Metric | Control | Variation | Change |
|---|---|---|---|
| Conversion Rate | 4.0% | 4.3% | +7.5% |
| Average Order Value | $110 | $95 | -13.6% |
| Revenue Per Visitor | $4.40 | $4.09 | -7.0% |
In this scenario, celebrating the conversion rate lift would be a massive, costly mistake. The variation actually made less money. Always analyze the full financial impact before you make the final call.
Scaling Winners and Learning from Losers
Once you have confirmed a true winner with statistical significance and a positive impact on RPV, it is time to act. Roll that winning variation out to 100% of the targeted traffic segment right away to start cashing in on the gains.
But what if the test is flat, or your new design loses? That is not a failure. It is a valuable lesson you paid a little bit of traffic to learn.
An inconclusive or losing test is just as important as a winning one. It tells you that your hypothesis was wrong, saving you from scaling a bad idea across your entire site. The data you gathered should directly inform your next, smarter hypothesis.
Go back to the drawing board. Why did the variation not work? Did it introduce confusion? Did it fail to calm a specific customer anxiety? Pull up the session recordings for the losing variation. Watching how real users interacted with it will almost always give you the clues you need for your next round of tests.
While A/B testing is a common approach, you can learn more about different methodologies by exploring the differences between multivariate testing vs A/B testing. The goal is to see optimization as a continuous cycle. Every test, win or lose, adds to your team's knowledge about what makes your customers tick. This growing library of insights builds a real, long-term competitive advantage.
Real Split Test Results: What Six Figures Looks Like
Theory is useful, but seeing real numbers from real tests makes the value of split testing concrete. Here are three examples from Convertibles client work that show what is possible when you apply this framework rigorously.
Homepage Storytelling Module: +$130K/Month
A luxury pajama brand was struggling with price objections. Visitors landed on the homepage, saw premium prices, and bounced without understanding why the products cost what they did.
The Test: We added an "Experience" module featuring the brand's origin story, design studio, and product craftsmanship narrative. This module was positioned above the customer reviews section.
The Result: +$130,251 monthly revenue. The key insight: price objections are not always about price. They are about value perception. By explaining the hand-painted, hand-screen-printed nature of the products before visitors encountered pricing, we reframed the product from a commodity to "wearable art."
Homepage Banner Copy: +$19K/Month
A VR gunstock brand tested two headline approaches on their homepage banner.
Control: "DOMINATE THE BATTLEFIELD WITH SPEED & PRECISION"
Variation: "THE BEST DAMN VR GUNSTOCK ON THE PLANET"
The Result: +$19,441 monthly revenue for the variation. The lesson: clear product identification plus confident positioning crushed vague benefit language. Simple and clear beats vague benefits.
Collection Page Triple-Element Test: +$114K/Month
An 8-figure slime brand tested progressive enhancements on their collection page, adding a hero banner, star ratings with review counts, and "LIMITED STOCK" labels.
The Result: +$114,870 monthly revenue. Three elements, six figures. Each layer contributed incrementally: the hero banner provided context, reviews established trust at the browse level, and stock labels created urgency without deception.
These are not outliers. They are what happens when you combine rigorous hypothesis building, proper statistical methodology, and a commitment to continuous testing.
Your Next Step: Launch a Smarter Test
This is the playbook for running split tests that actually move the needle. You now have a framework for digging into data, building a solid hypothesis, and measuring the real financial impact of your experiments. This is how you leave generic CRO advice behind and start building a system for growth.
This is not about landing one big win. It is about creating a culture of constant, intelligent improvement. The core ideas are simple but powerful: always start with data, zero in on your most valuable customer segments, and stay disciplined with your process. When you do that, your landing pages stop being static brochures and start becoming dynamic assets that make you more money.
Your First Test Checklist
Ready to launch? Use this checklist to guide your first test. It covers the non-negotiables for running a clean experiment that gives you trustworthy results.
- Define Your Goal: What is the one metric you are trying to improve? Be specific. Is it Conversion Rate, Revenue Per Visitor (RPV), or Average Order Value (AOV)?
- Dig for Data: Pull numbers from GA4, but do not stop there. Blend quantitative data with qualitative insights from customer surveys, reviews, or support tickets to find the why.
- Write a Sharp Hypothesis: Stick to the framework: "By changing X for Y segment, we expect Z outcome because of [data/insight]."
- Calculate Your Sample Size: Use our online calculator to figure out how much traffic you need per variation. Commit to that number. No peeking.
- Build a Focused Variation: Make one meaningful change based on your hypothesis. This is not the time to test fifty shades of blue.
- Run a Rigorous QA Check: Look for flicker, check rendering on different devices, click every link, and make sure your analytics are firing correctly on both versions.
- Launch and Be Patient: Let the test run until it hits statistical significance. Walking away and letting the data collect is half the battle.
- Analyze the Whole Picture: Check secondary metrics like RPV and AOV to see the full business impact before you call a winner.
The magic of split testing is not finding a single winner. It is in the library of customer knowledge you build over time. Every test, win or lose, teaches you something valuable about who your customers are and what they respond to. This is how you turn ad spend into a predictable profit machine and scale your brand.
Frequently Asked Questions
How long should I run a landing page split test?
Run your test until you reach the sample size you calculated upfront, typically two to four weeks for most Shopify Plus brands with healthy traffic. Never stop early because one variation looks like it is winning. That is called "peeking" and leads to false positives. The minimum is usually one full business cycle (at least one week) to account for day-of-week variations in customer behavior.
What is a good sample size for A/B testing landing pages?
The required sample size depends on your baseline conversion rate, the minimum effect you want to detect, and your desired confidence level (usually 95%). Use our online sample size calculator. For example, if your page converts at 3% and you want to detect a 15% relative improvement, you might need around 5,000-10,000 visitors per variation. Higher-traffic pages can detect smaller effects. Lower-traffic pages need to aim for bigger wins.
Should I test one element at a time or multiple changes?
For most tests, change one major element at a time. This makes it clear what caused the result. If you change the headline, hero image, and CTA button all at once and the variation wins, you will not know which change drove the lift. However, if you have high traffic and want to test multiple elements simultaneously, consider multivariate testing, which tests combinations of changes and requires more traffic to reach significance.
What should I test first on my landing page?
Start with high-impact elements above the fold: your headline, hero image, and primary call-to-action. These are what visitors see first and have the biggest influence on whether they stay or bounce. After that, test your value proposition, social proof placement, and offer structure. Save micro-optimizations like button colors for later. Focus on tests that address a real customer friction point identified in your data.
At CONVERTIBLES, we build and manage high-velocity personalization programs for Shopify Plus brands ready to scale profit per visitor. If you want a strategic partner to implement the advanced segment-driven testing discussed in this guide, book a call.