Ecommerce Conversion Rate by Industry (2026): 30+ Benchmarks

[ SUMMARIZE WITH AI ]
[ FREE CRO TEARDOWN ]
Find the 3 biggest revenue leaks on your store.
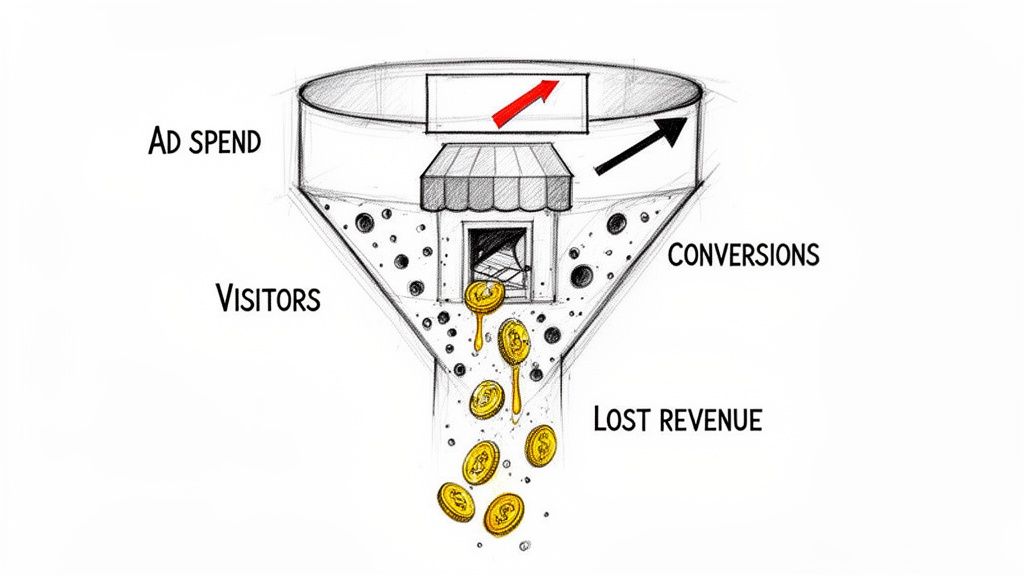
Every day a conversion leak goes unfixed, you're paying for traffic that doesn't buy. Get a 5-minute Loom through your PDP, cart, and checkout, with mockups of the fixes. No pitch.
Get My TeardownStop comparing your store to a meaningless "average." The global ecommerce conversion rate of 2.5% tells you almost nothing useful. What matters is how you stack up against brands in your specific industry, traffic mix, and customer base.
This is a data-driven breakdown of conversion rate benchmarks for 2026, segmented by industry, traffic source, device, and customer type. Use it to set realistic targets, identify your biggest gaps, and prioritize where to focus your optimization efforts.
Ecommerce Conversion Rate Benchmarks at a Glance
Skip the tables. Use our free ecommerce conversion rate calculator to see where your store sits in your vertical and the monthly revenue gap to the top performer baseline.
Here are the key ecommerce conversion rate benchmarks for 2026, based on industry data and results from 30+ Shopify Plus A/B tests:
- Global average: 2.5-3.0%, but this blended number is misleading. Segment by industry, device, and traffic source for useful benchmarks.
- By industry: Food and Beverage leads at 4.5-6.0%. Beauty and Cosmetics averages 3.0-4.0%. Apparel sits at 2.0-3.0%. Luxury and Jewelry trails at 0.8-1.2%.
- By traffic source: Email converts highest at 4.0-5.3%. Organic search averages 2.7-3.0%. Paid social is lowest at 0.7-1.2%.
- By device: Desktop converts at 3.5-4.0%. Mobile lags at 1.8-2.5% despite driving 65-75% of traffic for most stores.
- By customer type: Returning customers convert at 4.5-6.0%. First-time visitors convert at just 1.0-2.0%.
- Shopify stores: Average is 1.4%. Top 20% hit 3.2% or higher. Top 10% exceed 4.7%.
The most important metric is not your sitewide conversion rate. It is revenue per visitor by segment, which accounts for both conversion rate and average order value in a single number.
The Global Average Is Misleading. Here's What to Look at Instead.
The often-cited "average ecommerce conversion rate" of 2.5% to 3% is a blended number across every industry, traffic source, and store size. It's about as useful as knowing the average temperature on Earth when you're trying to pack for a trip to Iceland.
According to IRP Commerce, the all-industry average sits at 1.89%. Shopify's internal data shows their merchants averaging 1.4% overall, but this includes newer stores still finding their footing. More established ecommerce sites typically see 2.5% to 4%.
The range reflects different measurement methodologies and sample biases. Studies focusing on larger, established retailers report higher averages (3% to 4%), while those including newer or smaller stores trend lower (2% to 2.5%).
The real question isn't "What's the average?" It's "What should my store be hitting given my industry, traffic sources, and price point?" That's what the rest of this data will help you answer.
How Conversion Rates Have Shifted Over Time
Ecommerce conversion rates have remained surprisingly stable despite massive shifts in online shopping behavior. Here's the trajectory:
- 2020-2021: Pandemic-driven spikes pushed rates to 2.8% as consumers flooded online.
- 2022-2023: Rates dipped to around 2.4% amid economic uncertainty and rising ad costs.
- 2024-2025: Recovery to 2.7%, driven by AI-powered personalization and improved mobile experiences.
- 2026: Stabilizing in the 2.5% to 3% range for established stores.
The uptick in recent years reflects widespread adoption of personalization tools and better checkout experiences. However, increased competition and ad costs mean merchants need higher conversion rates just to maintain profitability.
Conversion Rate Benchmarks by Industry
Industry is the single biggest factor in determining what "good" looks like. A 2% conversion rate would be excellent for a luxury watch brand but mediocre for a snack subscription company.
The pattern is consistent: conversion rates correlate inversely with average order value and purchase complexity. Low-risk, frequent purchases convert higher. High-ticket, considered purchases convert lower.
2026 Ecommerce Conversion Rate Benchmarks by Industry
| Industry | Average CVR | Top Performer CVR | Key Driver |
|---|---|---|---|
| Food & Beverage | 4.5% - 6.0% | 6.0%+ | Low AOV, impulse buys, repeat purchases |
| Health & Beauty | 3.3% - 4.5% | 5.0%+ | Strong brand loyalty, subscriptions, UGC |
| Pet Care | 2.3% - 3.2% | 4.0%+ | Emotional purchases, repeat buying |
| Arts & Crafts | 3.0% - 3.5% | 4.5%+ | Passionate niche audience, low AOV |
| Toys & Games | 2.4% - 2.8% | 3.5%+ | Gifting, seasonal spikes |
| Apparel & Fashion | 2.0% - 2.8% | 3.5%+ | Trend-driven, sizing concerns |
| Home & Garden | 1.5% - 2.2% | 3.0%+ | Higher AOV, considered purchases |
| Consumer Electronics | 1.4% - 1.8% | 2.5%+ | Price comparison, spec research |
| Luxury & Jewelry | 0.8% - 1.2% | 1.8%+ | Long research cycles, high AOV |
These figures come from aggregated data across Dynamic Yield, IRP Commerce, ConvertCart, and Shopify's internal benchmarks.
What This Means for Your Store
If you're selling a $25 specialty sauce, you should be targeting 4%+. The purchase is low-risk, often impulsive, and frequently repeated.
If you're selling $2,000 watches, a 1.2% conversion rate might actually be solid. Customers research extensively before committing to that kind of purchase.
The takeaway: benchmark against your vertical, not the market average. A "below average" rate in food and beverage would be exceptional in luxury goods.
Conversion Rate Benchmarks by Traffic Source
Not all traffic is created equal. Where visitors come from dramatically affects how likely they are to buy. Understanding these differences helps you allocate budget intelligently and set appropriate expectations by channel.
2026 Conversion Rate Benchmarks by Traffic Source
| Traffic Source | Average CVR | Why It Converts This Way |
|---|---|---|
| Email Marketing | 4.0% - 5.3% | Opted-in audience, highly segmented, personalized offers |
| Direct Traffic | 3.3% - 3.8% | Brand-aware visitors with purchase intent |
| Referral Traffic | 2.9% - 3.5% | Trust transfer from referring source |
| Organic Search | 2.7% - 3.0% | Intent-driven, actively searching for solutions |
| Paid Search | 2.0% - 2.5% | Commercial intent, but comparison shopping |
| Paid Social | 0.7% - 1.2% | Interruption-based, discovery mode, low intent |
The gap between email (5%+) and social (under 1%) represents a potential 5x performance difference. This doesn't mean you should abandon social. It means you should set appropriate expectations and optimize accordingly.
A channel that sends you tons of traffic but generates zero sales isn't an asset. It's a revenue leak. Use these benchmarks to evaluate channel ROI, not just volume.
How to Use This Data
If your email conversion rate is below 4%, you have a segmentation or offer problem. Your email list already trusts you. They've opted in. If they're not converting, the content isn't relevant enough.
If your paid social is converting above 1.5%, you're doing something right. That's a hard channel to crack because users aren't in buying mode. Consider doubling down on what's working.
If organic search is underperforming, check your landing page relevance. Users arriving from search have specific intent. If the page doesn't match that intent, they bounce.
For a deeper look at connecting your paid campaigns to your onsite experience, our guide on high-converting Facebook ad strategies covers the tactical side of closing the ads-to-site gap.
Conversion Rate Benchmarks by Device
Mobile drives the majority of ecommerce traffic but still lags in conversions. The gap is closing, but it remains one of the biggest optimization opportunities for most stores.
2026 Device Conversion Rate Benchmarks
| Device | Traffic Share | Average CVR | Top Performer CVR |
|---|---|---|---|
| Desktop | ~28% | 3.5% - 4.0% | 5.0%+ |
| Mobile | ~70% | 1.8% - 2.5% | 3.5%+ |
| Tablet | ~2% | 3.0% - 3.5% | 4.0%+ |
Desktop converts at roughly 1.7x the rate of mobile, according to Smart Insights. This isn't because desktop users are fundamentally different. It's because mobile experiences are often harder to use: smaller screens, clunkier checkouts, more distractions.
The Mobile Opportunity
If mobile brings in 70% of your traffic but only accounts for 50% of your revenue, you've found a massive opportunity. Closing even part of that gap can be transformative.
Brands using optimized mobile checkouts, digital wallets (Apple Pay, Google Pay, Shop Pay), and streamlined forms are pushing mobile conversion rates into the 3%+ range.
The key areas to audit:
- Page load speed: Every second of delay costs conversions.
- Checkout steps: Fewer taps, more sales.
- Payment options: Digital wallets remove friction.
- Form fields: Auto-fill everything possible.
Understanding what website personalization is can help you tailor mobile experiences to specific user segments, which is one of the most effective ways to close the device gap.
Conversion Rate Benchmarks by Customer Type
The difference between new and returning visitors is one of the most underappreciated gaps in ecommerce analytics. Treating these groups the same is leaving money on the table.
2026 Conversion Rate Benchmarks by Customer Type
| Customer Type | Average CVR | What Drives Conversion |
|---|---|---|
| Returning Customers | 4.5% - 6.0% | Trust established, familiar with products |
| Returning Visitors (Non-Buyers) | 2.5% - 3.5% | Interest shown, need a push to convert |
| First-Time Visitors | 1.0% - 2.0% | Building trust, discovering the brand |
Returning customers convert at 2x to 3x the rate of first-time visitors. They already trust you. They know the product quality. The friction is gone.
What This Means for Optimization
If your blended conversion rate is low, dig into the split. A store with mostly new traffic will naturally have a lower overall rate than one with strong retention.
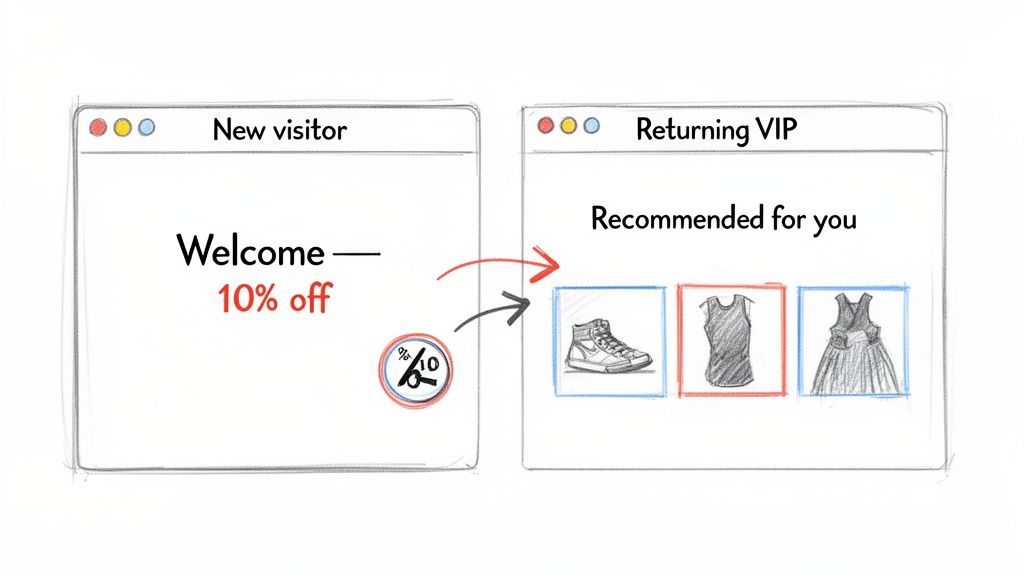
For first-time visitors, focus on trust-building: reviews, guarantees, clear return policies, and social proof. Also an AI chat that increases Shopify sales, handles the live product questions that static trust signals cannot answer helps a lot, converting hesitant visitors before they leave. They need to believe you're legitimate before they'll buy.
For returning visitors who haven't purchased, address hesitation directly. A banner reminding them of free shipping or your satisfaction guarantee can be the nudge they need.
For returning customers, make them feel valued. Personalized product recommendations based on past purchases, early access to new products, or a simple "Welcome back" can reinforce loyalty.
Our guide on ecommerce personalization examples shows how top Shopify brands tailor experiences for each of these segments.
Shopify-Specific Benchmarks
If you're on Shopify or Shopify Plus, here's how to contextualize these numbers for your platform.
According to Shopify's data and third-party analyses from LittleData and Blend Commerce:
- Average Shopify store: 1.4% conversion rate
- Top 20% of Shopify stores: 3.2%+ conversion rate
- Top 10% of Shopify stores: 4.7%+ conversion rate
- Optimized Shopify Plus merchants: 4% - 5%+ conversion rate
The 1.4% average includes many new or unoptimized stores. If you're running a serious operation with established traffic, you should be benchmarking against the top 20% (3.2%+), not the overall average.
Part of the gap between an average store and the top 20% is foundational: theme architecture, page speed, and a clean technical build are prerequisites before testing can compound, which is where a Shopify Plus development agency like EcomX fits. The rest is systematic experimentation layered on top of that foundation.
For Shopify-specific optimization tactics, our Shopify conversion rate optimization guide covers the platform's unique opportunities and constraints.
What Systematic Testing Actually Delivers: Results from 30+ Shopify Plus Tests
The benchmarks above show where you stand. These results show what's possible when you systematically optimize. The following data comes from A/B tests run by Convertibles across Shopify Plus brands, using Intelligems for experiment execution and Profit Per Visitor as the primary success metric.
Revenue Lifts by Page Type
| Page Type | Test | Monthly Revenue Lift | Key Insight |
|---|---|---|---|
| Product Page | Size selection layout | +$386,441 | Reorganizing existing elements with zero new features drove the largest single-test lift |
| Homepage | Brand storytelling module | +$130,251 | Framing value before price visibility justified premium positioning |
| Navigation | Mega menu quiz promotion | +$101,495 | Promoting a product quiz in mobile navigation turned browsers into guided shoppers |
| Cart Drawer | Free gift progress tiers | +$50,099 | Simple progress messaging outperformed complex visual indicators |
| Popups | Dollar-off vs. percentage offers | +$45,000 | Fixed dollar amounts with spend thresholds beat percentage discounts (+21% AOV) |
| Pricing | Price point optimization | +$40,573 | Asymmetric repricing lifted Profit Per Visitor by 54.7% without changing the product |
| Shipping | Free shipping threshold | +$28,939 | Raising the threshold from $49 to $59 lifted PPV by 6.5% without hurting conversion |
The pattern across 30+ tests: the biggest wins rarely come from cosmetic changes like button colors or font sizes. They come from understanding customer decision-making and removing friction at specific points in the buying journey. A product page layout rearrangement generated more revenue than most brands spend on paid ads in a year.
For a step-by-step guide to building this kind of testing discipline, see our CRO testing program framework for Shopify.
Beyond Conversion Rate: The Metrics That Actually Matter
Conversion rate is important, but it's not the whole picture. A store with a 5% conversion rate and $20 AOV might be less profitable than one with a 2% rate and $150 AOV. Model the revenue impact of a higher conversion rate at your own AOV to see the gap in dollars.
The metrics that matter for profitability:
- Revenue Per Visitor (RPV): Conversion rate × Average Order Value. This is the true measure of how much each visitor is worth.
- Profit Per Visitor: Takes margin into account. A high-converting, low-margin product might be worse than a lower-converting, high-margin one.
- Customer Acquisition Cost (CAC): What you're paying to get that visitor in the first place.
- Lifetime Value (LTV): A lower conversion rate on first purchase might be acceptable if those customers have high repeat rates.
This plays out in real tests. In a pricing optimization experiment for an 8-figure wellness brand, raising the price on one SKU from $99 to $125 while lowering another from $99 to $90 lifted Profit Per Visitor by 54.7% and added $40K/month. A 50% site-wide discount only improved PPV by 13.6%. The "obvious" move of slashing prices to boost conversions would have left tens of thousands on the table every month.
For a deeper dive into optimizing for the right metrics, our guide on improving customer lifetime value covers how to think beyond the first transaction.
How to Benchmark Your Own Store
Raw benchmarks are only useful if you know how to apply them. Here's how to contextualize these numbers for your specific situation.
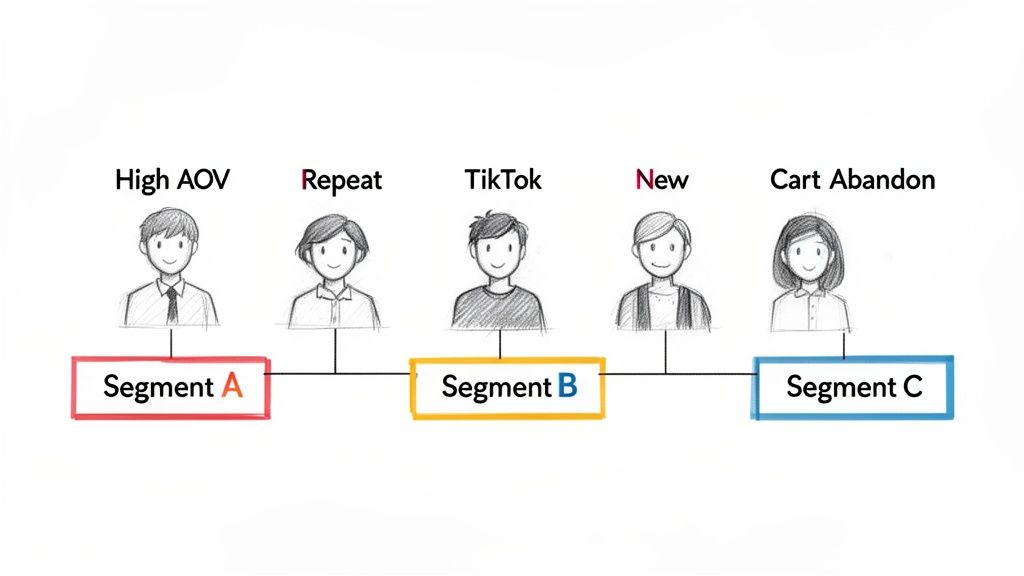
Step 1: Segment Your Data
Don't look at your overall conversion rate. Break it down by:
- Traffic source (email, organic, paid, direct, social)
- Device (desktop, mobile, tablet)
- Customer type (new vs. returning)
- Landing page or entry point
This is where Google Analytics and Shopify's built-in reports become essential. You can also use tools like Klaviyo to understand how your email segments perform differently.
Step 2: Compare Against Industry + Channel
A 2% conversion rate from paid social in fashion is actually good. A 2% rate from email in food and beverage is a problem.
Use the tables above to set realistic targets for each segment, not a single blanket goal.
Step 3: Identify Your Biggest Gaps
Where are you furthest from the benchmark? That's your highest-leverage opportunity.
If your mobile rate is 1.2% when the benchmark is 2.5%, that's a clear signal to prioritize mobile optimization.
If your email is converting at 2% when it should be 4%+, your segmentation or offer strategy needs work.
Step 4: Set Incremental Targets
Don't try to jump from 1.5% to 4% overnight. Set quarterly targets that push toward the benchmark while remaining achievable.
A structured testing program is how you get there. Our guide on multivariate testing vs. A/B testing covers how to choose the right methodology for your traffic level and goals.
Frequently Asked Questions
What Is a Good Ecommerce Conversion Rate in 2026?
It depends on your industry and traffic mix. The global average is 2.5% to 3%, but this varies dramatically. Food and beverage brands should target 4%+. Luxury goods might be happy with 1.2%. Shopify's data suggests that if you're above 3.2%, you're in the top 20% of stores.
Why Is My Conversion Rate Lower Than the Benchmark?
Several factors could be at play: your traffic mix might skew toward lower-intent channels (like social), your mobile experience might have friction, or your price point might require longer consideration. Segment your data before diagnosing the problem.
How Do I Calculate Conversion Rate Correctly?
Conversion Rate = (Number of Orders ÷ Number of Sessions) × 100. For benchmark comparisons, use sessions, not users. Most industry studies calculate based on sessions, and using users will inflate your rate by 2x to 3x.
Should I Benchmark Against Industry Averages or My Own History?
Both. Industry benchmarks tell you if you're competitive in your market. Your own historical data tells you if you're improving. The goal is to consistently beat your own baseline while closing the gap to top performers in your vertical.
How Much Traffic Do I Need for Reliable Conversion Data?
For statistically significant A/B test results at a 2% baseline conversion rate, you need roughly 50,000 visitors per variant (100,000 total for a simple A/B test). For directional insights and trend analysis, you can work with less, but be cautious about drawing conclusions from small samples.
What Results Can Systematic CRO Testing Deliver?
Results vary by store size, traffic, and starting point, but structured testing programs consistently outperform one-off optimizations. Across 30+ Shopify Plus A/B tests, individual winning experiments have generated between $6,000 and $386,000 in additional monthly revenue. The highest-impact tests tend to focus on product page layout, navigation, and pricing strategy rather than cosmetic changes. A structured program running 2-3 tests per month can realistically target 15-30% cumulative revenue lift within the first year.
Benchmarks are a starting point, not a finish line. The real work is systematically testing and optimizing to close the gap between where you are and where you could be. For the tactical playbook, see our 12-fix guide on how to improve ecommerce conversion rate. If you'd rather bring in help, here's how to choose an ecommerce CRO agency.
At CONVERTIBLES, we help Shopify Plus brands move beyond generic conversion optimization toward personalized experiences that lift revenue per visitor. If you're ready to see how your store stacks up and where the biggest opportunities are hiding, book a strategy call to discuss your roadmap.