7 Reasons Your Shopify Conversion Rate Is Below Average (And How to Fix Each)

[ SUMMARIZE WITH AI ]
[ FREE CRO TEARDOWN ]
Find the 3 biggest revenue leaks on your store.
Every day a conversion leak goes unfixed, you're paying for traffic that doesn't buy. Get a 5-minute Loom through your PDP, cart, and checkout, with mockups of the fixes. No pitch.
Get My TeardownIf your Shopify store's conversion rate is sitting below 2%, something is broken. The good news, it's almost always one of seven fixable problems.
This guide will help you diagnose exactly what's dragging down your conversions so you can stop guessing and start fixing the right things.
What Counts as a "Low" Conversion Rate?
Before diagnosing problems, you need a benchmark. Here's where Shopify stores typically fall: *Highly dependent on industry, averages below for a guide. For a vertical-specific read on where your store ranks, use our free ecommerce conversion rate calculator.
| Performance Tier | Conversion Rate | What It Means |
|---|---|---|
| Below average | Under 1.5% | Significant issues hurting conversions |
| Average | 2.5% - 3% | Room for improvement but functional |
| Top 20% | 3.2%+ | Well-optimized store |
| Top 10% | 4.7%+ | Elite performance |
If you're a DTC brand doing $2M+ annually and converting below 2%, you're likely leaving millions on the table. A $10M store improving from 2.5% to 3.2% adds $2.8M in annual revenue without spending another dollar on ads. To put a number on your own gap, run it through our CRO revenue impact calculator.
The 7 Most Common Causes of Low Conversion Rates
After running optimization programs for many 8 and 9-figure Shopify brands, these are the problems we see killing conversion rates over and over again.
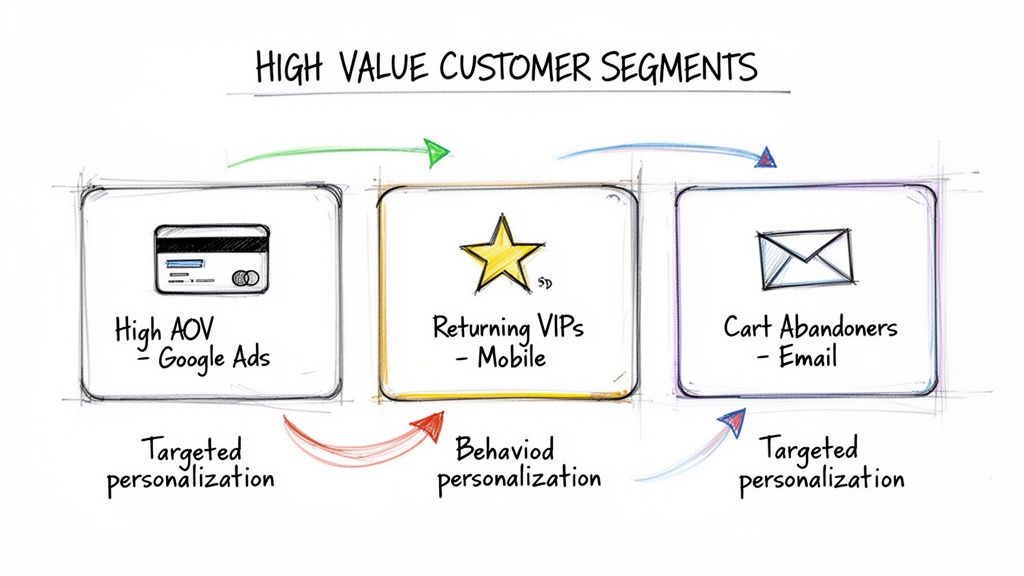
1. You're Treating Every Visitor the Same
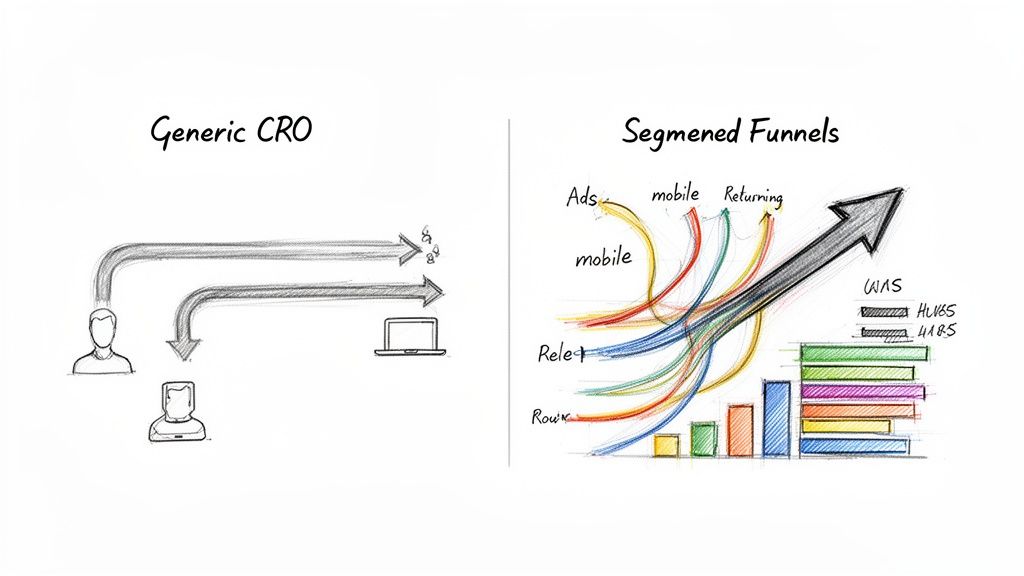
This is the most common conversion killer. Your website shows the exact same experience to everyone: first-time visitors from Google Ads, returning VIP customers from email, cart abandoners coming back, and casual browsers from social media.
The problem: A first-time visitor needs social proof and trust signals. A returning customer needs a streamlined path to checkout. A cart abandoner needs a reminder of what they left behind. When everyone sees the same generic homepage, nobody gets what they actually need to convert.
How to diagnose:
- Check if your conversion rate varies dramatically by traffic source (it shouldn't vary by more than 50%)
- Compare new vs. returning visitor conversion rates
- Look at mobile vs. desktop performance gaps
The fix: Implement website personalization that delivers different experiences based on visitor segments. Even basic segmentation (new vs. returning, traffic source, device type) can lift conversions 10-30% for specific audiences.
2. Your Ads Promise Something Your Landing Page Doesn't Deliver
You're spending $50,000+ monthly on ads, but when visitors click through, they land on a generic homepage that has nothing to do with the ad they just saw. This disconnect creates instant confusion and friction.
The problem: Your TikTok ad featured a specific product with a specific offer. The visitor clicks and lands on your homepage with a completely different hero image, no mention of the offer, and no clear path to the product they wanted. They bounce.
How to diagnose:
- Compare bounce rates on your landing pages vs. site average (if landing page bounce rate is 20%+ higher, you have a continuity problem)
- Check if your highest-spend ad campaigns have lower-than-average conversion rates
- Manually click through your top 5 ads and evaluate the landing page experience
The fix: Build ads-to-site continuity using UTM parameters. When someone clicks an ad for "20% off summer dresses," they should land on a page showing that exact offer with matching imagery. Tools like Intelligems can dynamically swap landing page content based on the ad source.
3. Your Mobile Experience Is Broken
Nearly 70% of ecommerce traffic comes from mobile devices, but most stores still optimize primarily for desktop. If your mobile conversion rate is less than half your desktop rate, mobile UX is killing your overall numbers.
The problem: Tiny tap targets, slow page loads, forms that require zooming, checkout flows that take 6+ steps on mobile. Research shows nearly 30% of mobile shoppers abandon a purchase if the experience is even slightly frustrating.
How to diagnose:
- Check your mobile vs. desktop conversion rate in Google Analytics (mobile should be at least 60% of desktop)
- Test your checkout flow on your own phone, timing how long it takes
- Run Google's PageSpeed Insights on your mobile site
- Watch session recordings of mobile users to see where they struggle
The fix: Prioritize mobile-first design. Simplify navigation, ensure buttons are thumb-friendly, compress images for faster loading, and streamline checkout to 3 steps or fewer, test 3 page checkout vs 1 page checkout. Consider mobile-specific features like Apple Pay and Google Pay.
4. You Have No Social Proof Where It Matters
Reviews exist somewhere on your site, but they're not visible at the moment of decision. New visitors, especially those from paid ads, need immediate trust signals to overcome purchase anxiety.
The problem: Your product pages bury reviews below the fold. Your homepage has no testimonials. Your checkout has no trust badges. First-time visitors see no evidence that real people have bought from you and had a good experience.
How to diagnose:
- Check if reviews are visible above the fold on product pages
- Look at your homepage for customer testimonials, press logos, or UGC
- Check if your checkout shows trust signals (secure payment badges, reviews, guarantees)
- Compare conversion rates for products with many reviews vs. products with few
The fix: Add social proof at every decision point. Put star ratings near the add-to-cart button. Add a testimonials section to your homepage. Include trust badges and a "100+ 5-star reviews" callout in your cart drawer. One of our tests found that adding a storytelling module with social proof to the homepage drove $130K/month in additional revenue.
5. Your Checkout Has Too Much Friction
The average cart abandonment rate is around 70%. If yours is higher, your checkout process is likely the culprit.
The problem: Forcing account creation before checkout. Surprising customers with shipping costs at the last step. Requiring too many form fields. Not offering their preferred payment method. Each friction point gives shoppers a reason to leave.
How to diagnose:
- Check your cart-to-checkout rate (what % of people who add to cart actually start checkout)
- Check your checkout completion rate (what % of people who start checkout actually purchase)
- Look for drop-off points in your checkout funnel
- Test the checkout yourself: how many fields? How many steps? Any surprises?
The fix: Enable guest checkout. Show shipping costs early (or offer free shipping). Reduce form fields to the absolute minimum. Offer express payment options (Shop Pay, Apple Pay, PayPal). Our cart drawer optimization tests have generated $155K/month in wins by reducing friction before checkout even begins.
6. Your Value Proposition Is Unclear
Visitors land on your site and can't quickly understand what you sell, why it's different, or why they should buy from you instead of Amazon or a competitor.
The problem: Your homepage headline is vague ("Premium Quality Products"). Your product descriptions focus on features, not benefits. There's no clear answer to "why should I buy this from you?"
How to diagnose:
- Show your homepage to someone unfamiliar with your brand for 5 seconds, then ask what you sell and why it's different
- Check your homepage bounce rate (if over 50%, your value prop isn't landing)
- Read your product descriptions: do they explain why this product matters to the customer?
The fix: Clarify your headline to communicate what you sell + your key differentiator. Focus product descriptions on benefits and outcomes, not just specs. Add comparison content that shows why you're better than alternatives. One homepage banner copy test generated $19K/month by clarifying the value proposition.
7. You're Running the Wrong Tests (or No Tests at All)
Many brands either don't test at all (making changes based on gut feeling) or test the wrong things (button colors, minor copy tweaks) that can't meaningfully move conversions.
The problem: You redesigned your product pages based on what looked good to the team, not what converts. Or you've been A/B testing small changes for months with no significant wins. Meanwhile, your core conversion problems go unaddressed.
How to diagnose:
- Review your last 5 site changes: were any of them based on test data?
- If you are testing, check your win rate (industry average is around 20-30%)
- Look at the impact of your winning tests: are they moving the needle on revenue, or just showing tiny lifts?
The fix: Build a systematic CRO testing program focused on high-impact experiments. Test for specific segments, not generic audiences. Measure revenue per visitor, not just conversion rate. Follow CRO best practices to ensure your tests reach statistical significance. Aim for 2-4 meaningful experiments per month.
How to Diagnose Your Specific Problems
You probably have 2-3 of these issues, not all seven. Here's how to identify which ones are actually hurting your store:
Step 1: Check Your Funnel Drop-offs
In Google Analytics, look at where people exit:
- High homepage bounce rate (50%+): Value proposition problem (#6) or mobile UX problem (#3)
- Low product page to cart rate: Social proof problem (#4) or value proposition problem (#6)
- Low cart to checkout rate: Checkout friction problem (#5) or pricing/shipping surprise
- Low checkout completion rate: Checkout friction problem (#5)
Step 2: Segment Your Data
Break down conversion rates by:
- Traffic source: If paid traffic converts way lower than organic, you have an ads-to-site continuity problem (#2)
- Device: If mobile is less than 60% of desktop, you have a mobile UX problem (#3)
- New vs. returning: If new visitors convert way lower, you have a social proof/trust problem (#4)
Step 3: Watch Real Users
Install a session recording tool (Hotjar, FullStory, Microsoft Clarity) and watch 20-30 sessions of users who didn't convert. Look for:
- Where do they hesitate or scroll back up?
- What do they click that doesn't work as expected?
- Where do they abandon?
This qualitative data often reveals problems that quantitative data misses.
Prioritizing Your Fixes
Once you've identified your problems, prioritize fixes based on:
- Traffic volume affected: A checkout friction problem affecting 100% of buyers is higher priority than a landing page problem affecting one ad campaign
- Severity of drop-off: Fix the biggest leaks first
- Ease of implementation: Quick wins build momentum for bigger projects
For most brands, the highest-impact fixes are:
- Mobile checkout optimization (affects majority of traffic)
- Adding social proof to key decision points (relatively easy, high impact)
- Implementing basic personalization for top traffic segments (compounds over time)
FAQ: Diagnosing Low Conversion Rates
What's the fastest way to find out why my conversion rate is low?
Start by segmenting your conversion rate data by device (mobile vs. desktop), traffic source (paid vs. organic vs. direct), and visitor type (new vs. returning). Whichever segment has the biggest gap from your average is where your biggest problem lives. Then watch 20-30 session recordings from that segment to see exactly where users struggle.
My conversion rate dropped suddenly. What should I check first?
Check for technical issues first: broken checkout, slow page loads, or payment gateway errors. Then check if a recent site change coincided with the drop. Look at your traffic mix: if you recently scaled a new ad channel, that traffic might convert differently than your existing audience. Finally, check for seasonal factors or competitor activity.
How long does it take to improve a low conversion rate?
Quick fixes (adding trust badges, fixing mobile UX bugs, clarifying copy) can show results within days. Systematic improvements through testing typically take 2-4 weeks per experiment to reach statistical significance. A well-run optimization program usually starts showing meaningful revenue impact within 60-90 days, with compounding gains over time.
Should I focus on conversion rate or traffic first?
Fix conversion rate first. Driving more traffic to a broken funnel just wastes more ad spend. Once your store converts at a healthy rate (2.5%+ for most categories), then scaling traffic becomes profitable. Think of it this way: a 20% improvement in conversion rate is equivalent to a 20% reduction in customer acquisition cost.
What tools help diagnose conversion rate problems?
For quantitative analysis: Google Analytics 4, Shopify Analytics, and Intelligems for testing and personalization. For qualitative insights: Hotjar, FullStory, or Microsoft Clarity for session recordings and heatmaps. For competitive benchmarking: Littledata provides Shopify-specific conversion benchmarks by industry.
My conversion rate is average but revenue is flat. What's wrong?
Look beyond conversion rate to average order value (AOV) and customer lifetime value (LTV). You might be converting customers but not maximizing their purchase value. Focus on increasing AOV through bundling, upsells, and free shipping thresholds, or on improving LTV through retention strategies.
A low conversion rate is a symptom, not a diagnosis. The brands that win are the ones who systematically identify their specific problems and run disciplined experiments to fix them, rather than copying generic "best practices" that may not apply to their store. Once you have diagnosed the leak, our 12-fix guide on how to improve ecommerce conversion rate walks through the tactical playbook.
At CONVERTIBLES, we help 8 and 9-figure Shopify brands diagnose exactly what's hurting their conversion rates and build testing programs that fix the right problems. We design, ship, and validate 2-4 high-impact experiments every month to systematically improve your profit per visitor.